
Your dashboard.
Watch your DSR volume and response performance over time.
Open ai.trustsuperset.com/dsars/dashboard. The DSR Analytics Dashboard is where you watch volume and response performance over time.
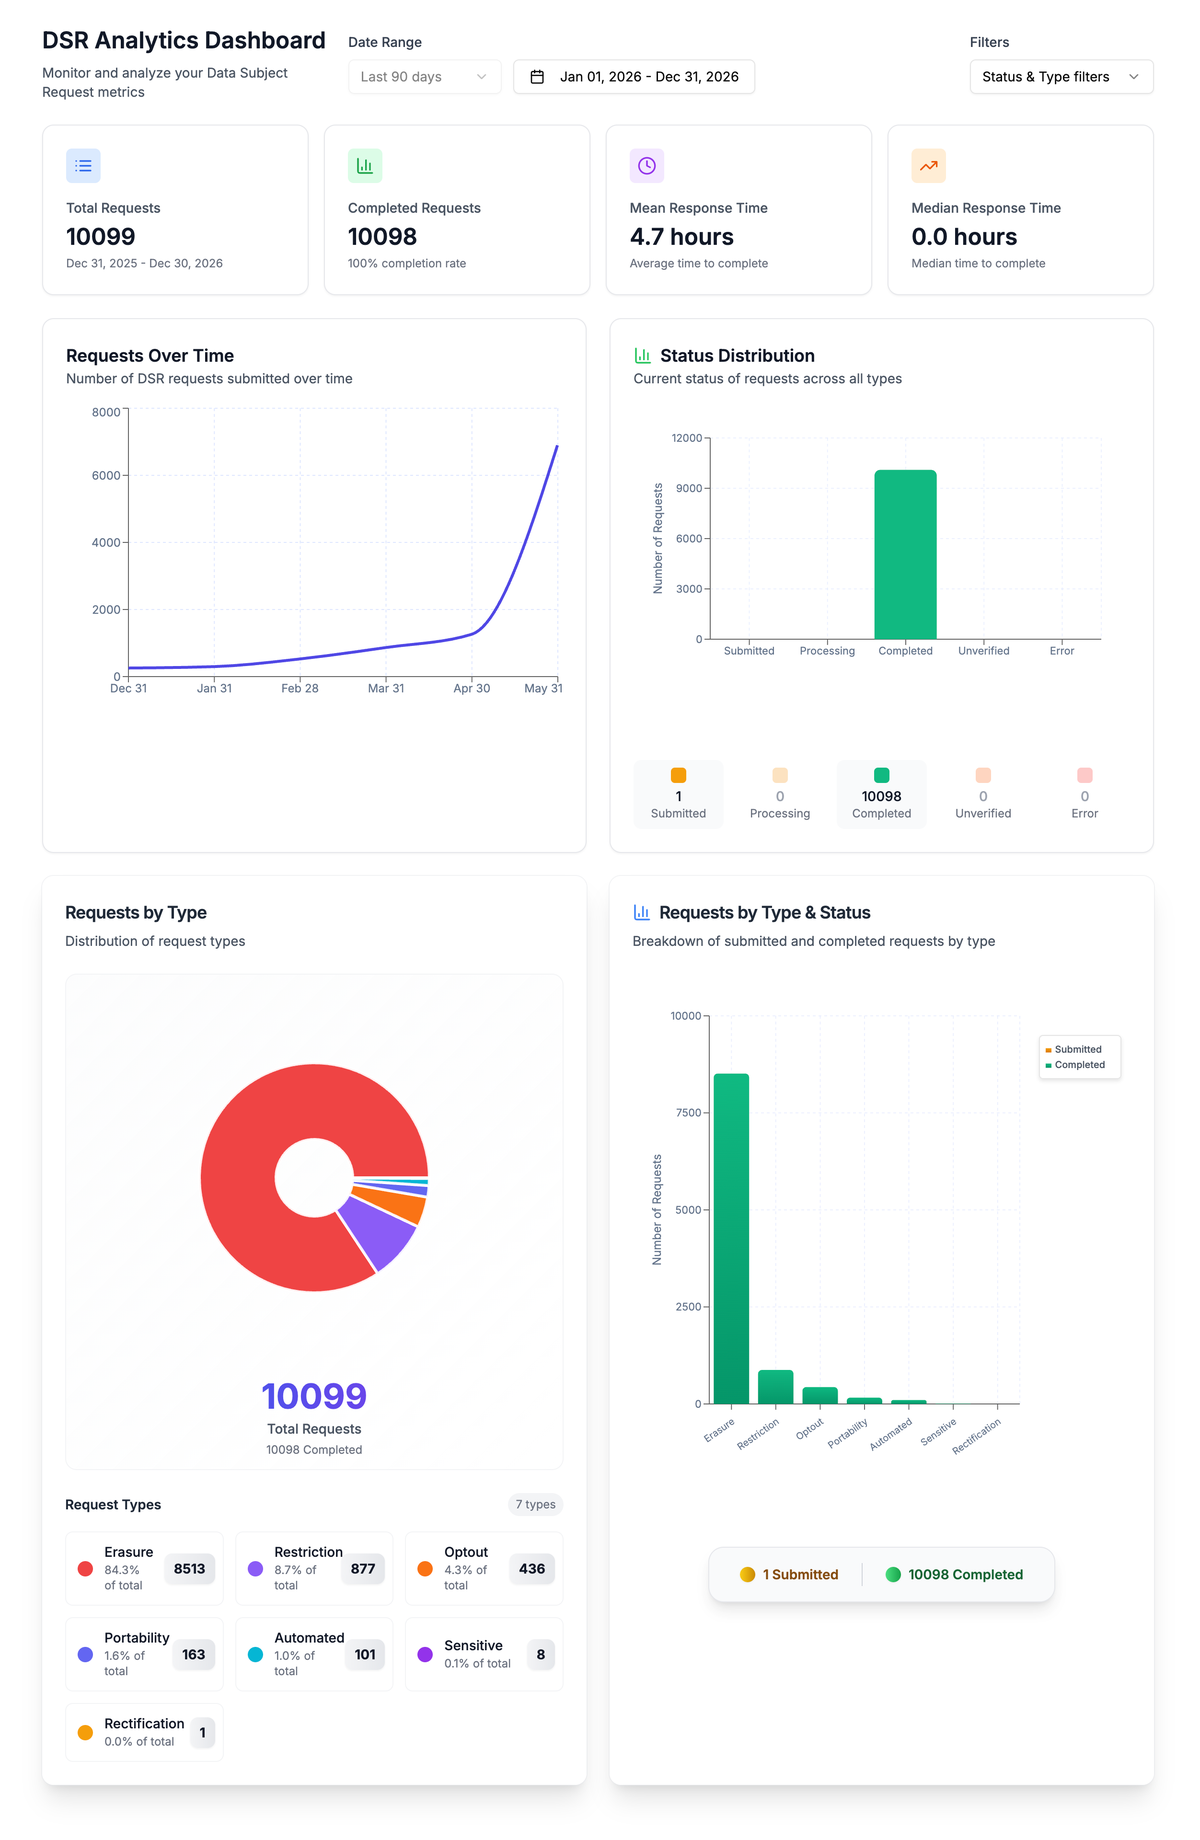
Filter to the slice you need
Filter the whole dashboard by date range and by status and type. That makes it easy to pull a specific window, like last quarter or a full calendar year, or to zero in on a single right.
How to put it to work
- Tune your automation. This is the picture that should drive your automation decisions. When a right type you're still handling by hand starts showing up at real volume, that's your cue to turn its toggle on.
- Catch backlogs early. Watch the status distribution and your response times. If Submitted or Processing is stacking up, or your median response time is climbing, a backlog is forming, usually a sign to enable Auto-Reply or auto-execution.
Pull your California § 7102 metrics
If you're a California-registered data broker, § 7102 requires you to post DSR metrics on your website by July 1 each year, covering the prior calendar year. For each request type below, you report how many you received, complied with in whole or in part, and denied:
- Requests to delete personal information
- Requests to know or access the personal information collected
- Requests to know what personal information was sold or shared, and to whom
- Requests to opt out of the sale or sharing of personal information
- Requests to limit the use and disclosure of sensitive personal information
You also report the median and mean number of days you took to substantively respond. Filter the dashboard to the calendar year and read these off: the counts from requests by type and status, and the response times from the mean and median tiles up top.